Getting started with an 32-bit ARM-based microcontroller is always a little daunting. There’s a plethora of available microcontrollers, platforms, development boards, tools, and software. Everyone seems to have their own opinion on what is best to use, and debates between the available options range in tone from pleasant and insightful to divisive and vitriolic. It can be quite confusing to work out exactly how one should get going - I certainly remember it being so, at any rate!
Well, in this tutorial I’m aiming to de-mystify things a little, targeting the very challenges that I myself faced when I first got started. I’ll walk through project initialisation, introducing the peripheral and clock configuration options, and illustrate the ST CubeMX code generator traps. I’ll then show off tools for debugging, something that everybody should know a little about. Finally, I’ll demonstrate the ST-Link’s integrated Virtual COM Port, which is a handy feature built in to my development kit.
While my normal ARM programming environment is currently based on Visual Studio Code, for this tutorial blogpost I’m actually going to use the STM32CubeIDE, as it’s free, it was only semi-recently released, and I’m interested in its capabilities — especially with the debugger. Debugging for me in the past has been through the nightmare-inducing (but indisputably powerful) command line interface for OpenOCD.
Hey, is this blog post an advertisment?
No, but I wish it was! How does one get into that gig? Seriously, let me know. :-)
Sadly, I’m just writing about ST offerings since I currently only own three ARM-based development boards. Two of them are made by ST, are quite cheap, and are reasonably friendly to hobbyists and beginners. My other board is the Terasic DE10-Standard, which is none of those things - however, as the DE10-Standard is freaking awesome, I will no doubt blog about it in future.
I’ve also worked extensively with ST products throughout my academic and industrial career, so I have a bit of institutional knowledge to go along with these dev boards.
Getting started: Choose a development board / platform
First, before you download and instally anything, make sure you actually have something to program!
As mentioned, I have two ST dev boards; the stm32f4-discovery series STM32F429I-DISC1 and the stm32nucleo series NUCLEO-F303RE, as seen here:
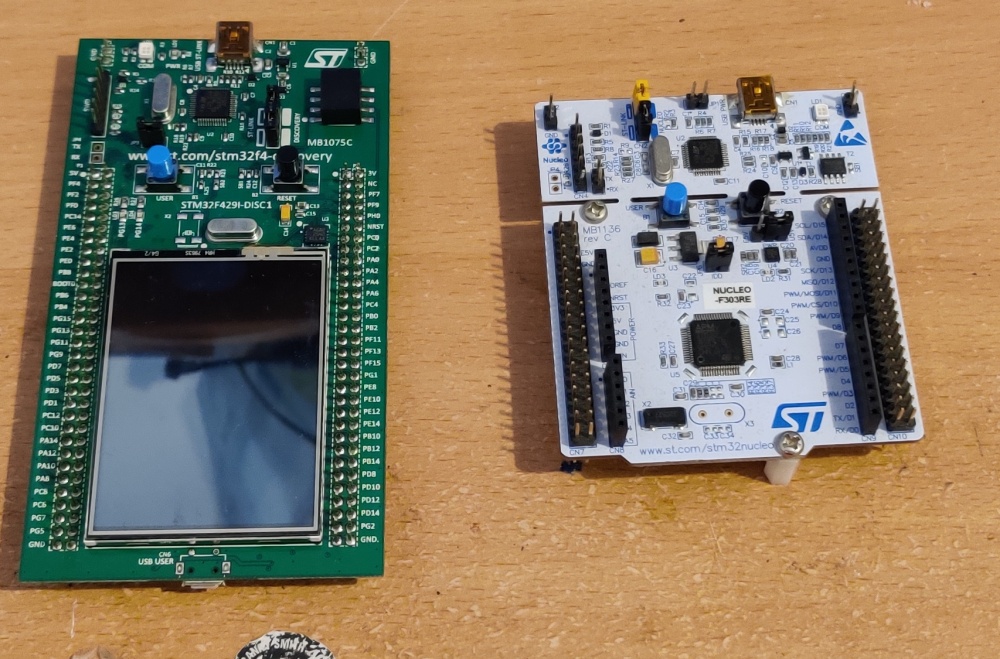
If you’re looking for a review of these, I like both of them quite a lot. The discovery board is great since it has an integrated LCD screen and a big on-device SDRAM chip, and the nucleo board is neat since it is quite cost effective and has both Arduino-compatible headers as well as its own larger array of I/O to work with.
As it’s the cheaper board, this tutorial will focus on the NUCLEO-F303RE development board.
However, as the steps can easily be generalised, you should be able to follow along with almost any other STM32-based development board.
For your convenience these are two purchase links for the dev boards, for the Nucleo-F303RE and the STM32F429I-DISC1. Note that these are Amazon referral links. I’ve found Amazon usually has cheaper prices than anyone else, but you can also shop around for a deal that looks good to you. Also, while the official ST boards are nice, but you might also be able to find third party ones that are cheaper (although they often come with less documentation / worked examples).
Getting started: Install STM32CubeIDE
There are a lot of different software development environments that will work with the STM32 line of microcontrollers. Today I’m going to focus on ST’s own IDE: STM32CubeIDE. It includes the necessary drivers, compilers, and the debugger all in a nice eclipse package.
So, let’s get started. You can download and install CubeIDE from their website. It’s free, although you do have to sign up an account / give them your email address. My first impressions are very positive - ST have provided binaries for every platform (yay Debian/Linux).
Anyway, here’s the steps, I’m sure I don’t need to go into detail here:
- Download the correct version for your operating system (I grabbed the Debian bundle since I’m running an Ubuntu system)
- Extract the installer
- Install with adminstrator privileges
- Run
(I trust it’s as easy as this to install on Windows, but who knows?)
Alright, you’re good to go - preliminaries finished!
Your first project
Before we can start writing code we need to create a project.
This is similar to most other IDEs - projects are used to bundle together all of your settings, code, and definitions into a single collection all managed from the same application (hence the name IDE, which stands for Integrated Development Environment).
The alternative would be to have multiple programs to handle your development, for instance using CubeMX for your chip configuration, vi or emacs to code, standalone ST-Link drivers for programming, OpenOCD for debugging, and so on.
This is a more fiddly approach, but some developers prefer it.
At any rate, here’s what CubeIDE looks like - yep, that sure looks like an eclipse-based environment.
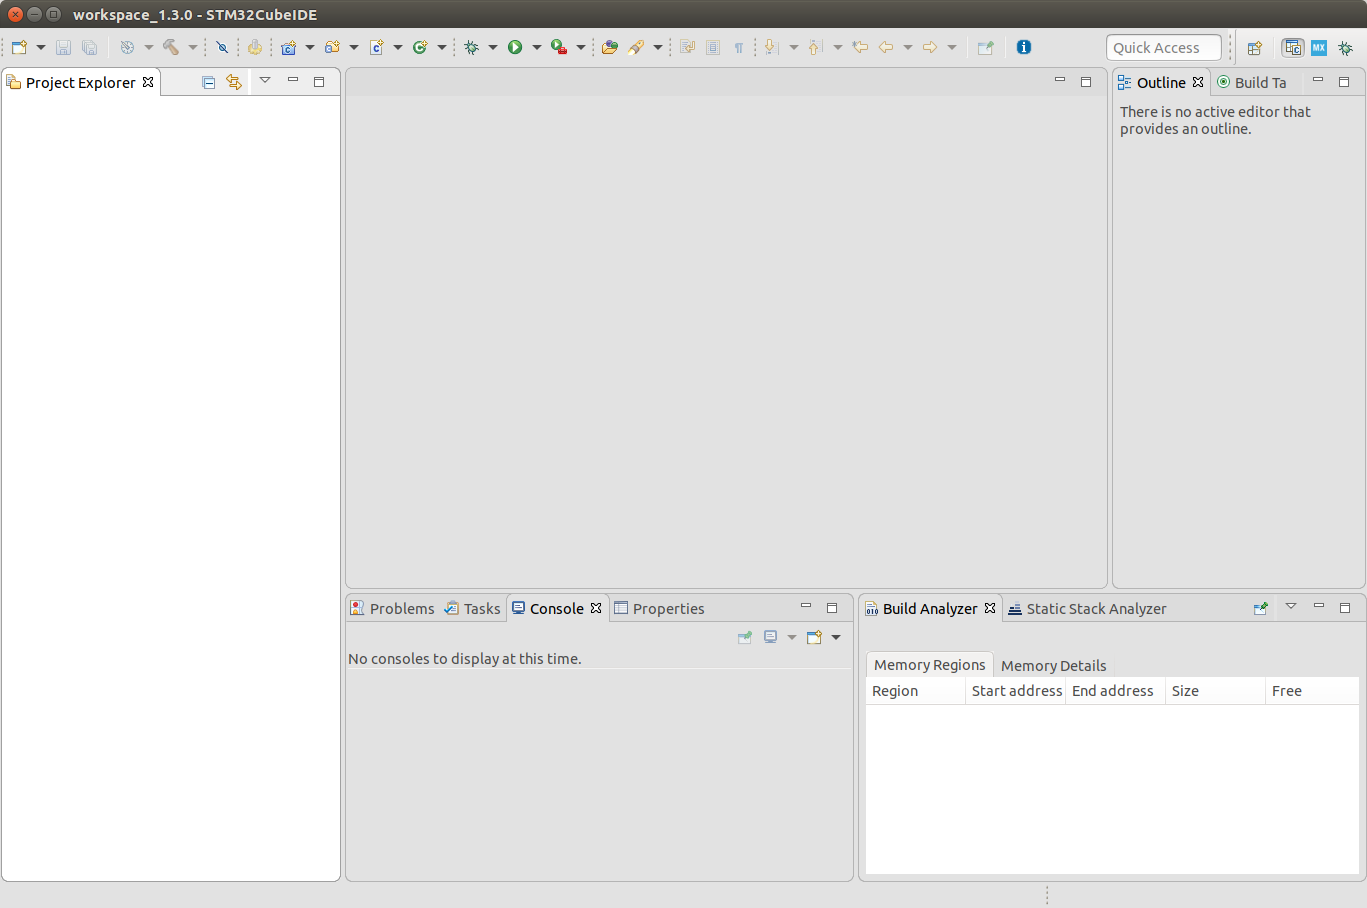
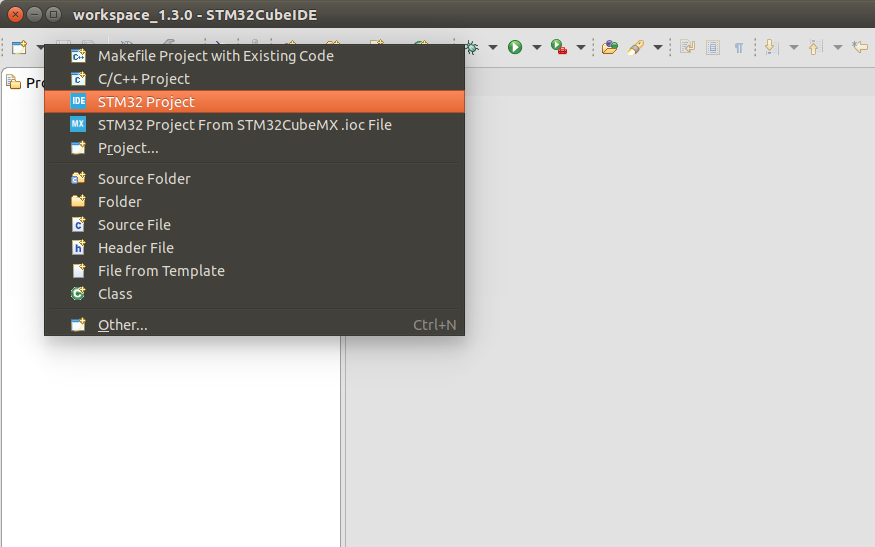
As CubeIDE is eclipse-based, I know to look under the top left icon (Or under the menu File > New > STM32 Project) to get started:
This will now think for a moment (a popup may appear briefly) and then show you the chip/board selector. This menu appears to be copied from their standalone STM32CubeMX program.
Since I have the Nucleo-F303RE, that’s what I’m going to search for, after selecting Board Selector at the top:
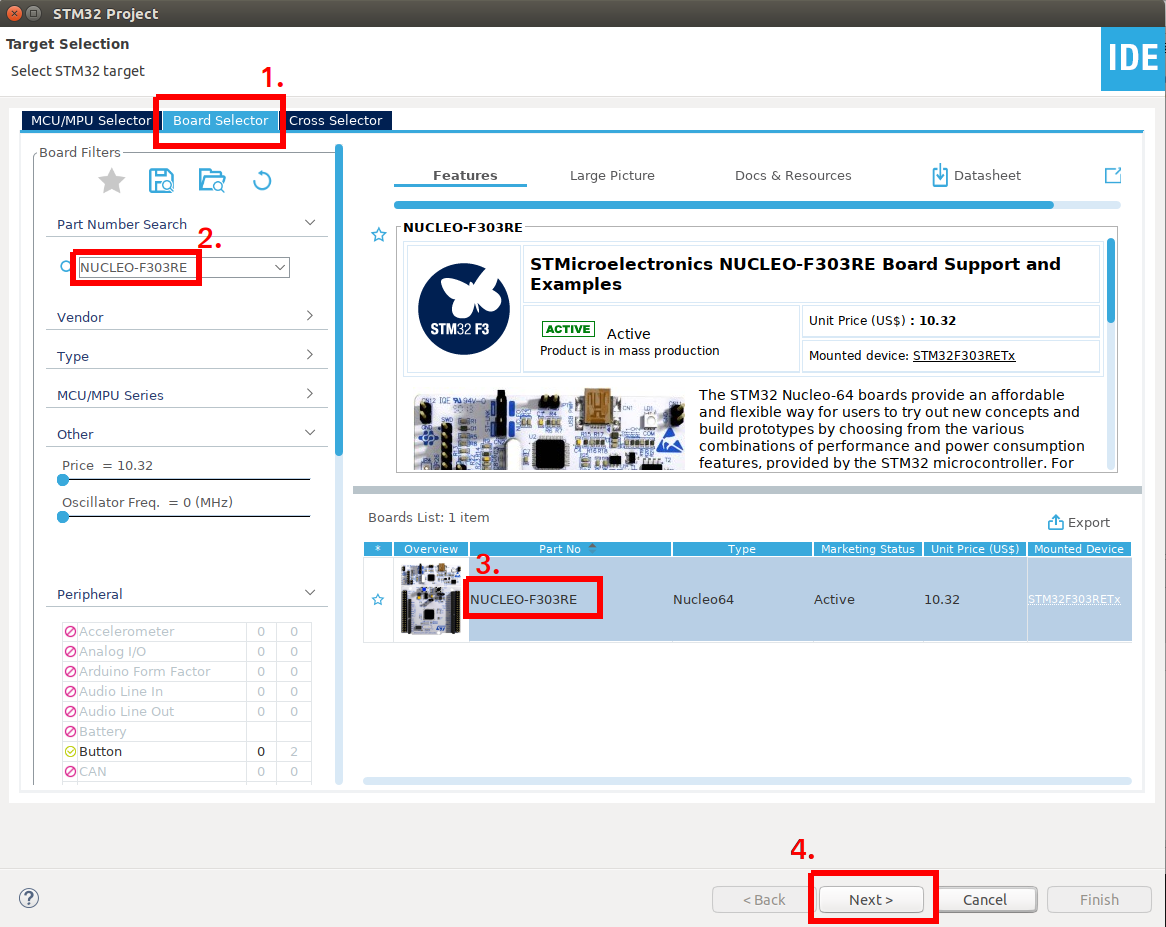
I like that it shows me the picture of the kit, that’s kind of neat. Now, pick a sensible project name:
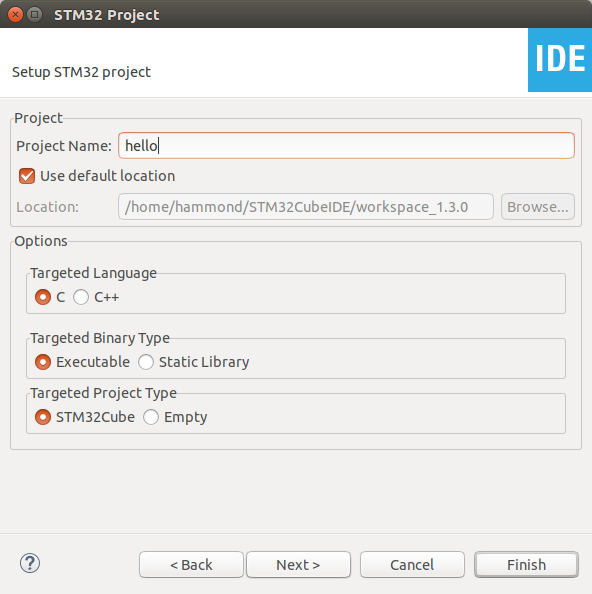
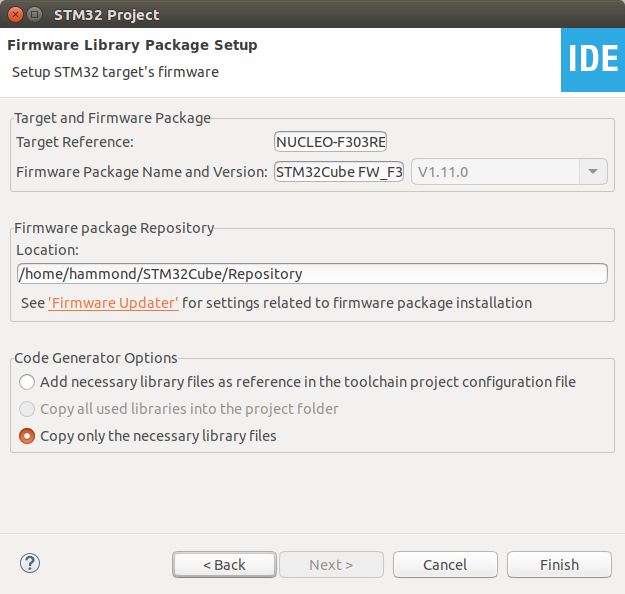
I didn’t change anything in the final window. Hit finish and let’s move on!
I then got a popup asking me if I wanted to initialise peripherals to their default configuration.
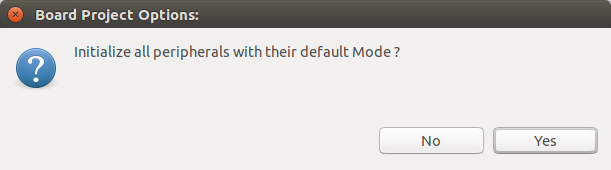
I assume this means the peripherals should be set up for the hardware on my development board. I’ll hit yes.
I now get the CubeMX configuration menu view. This looks like this:
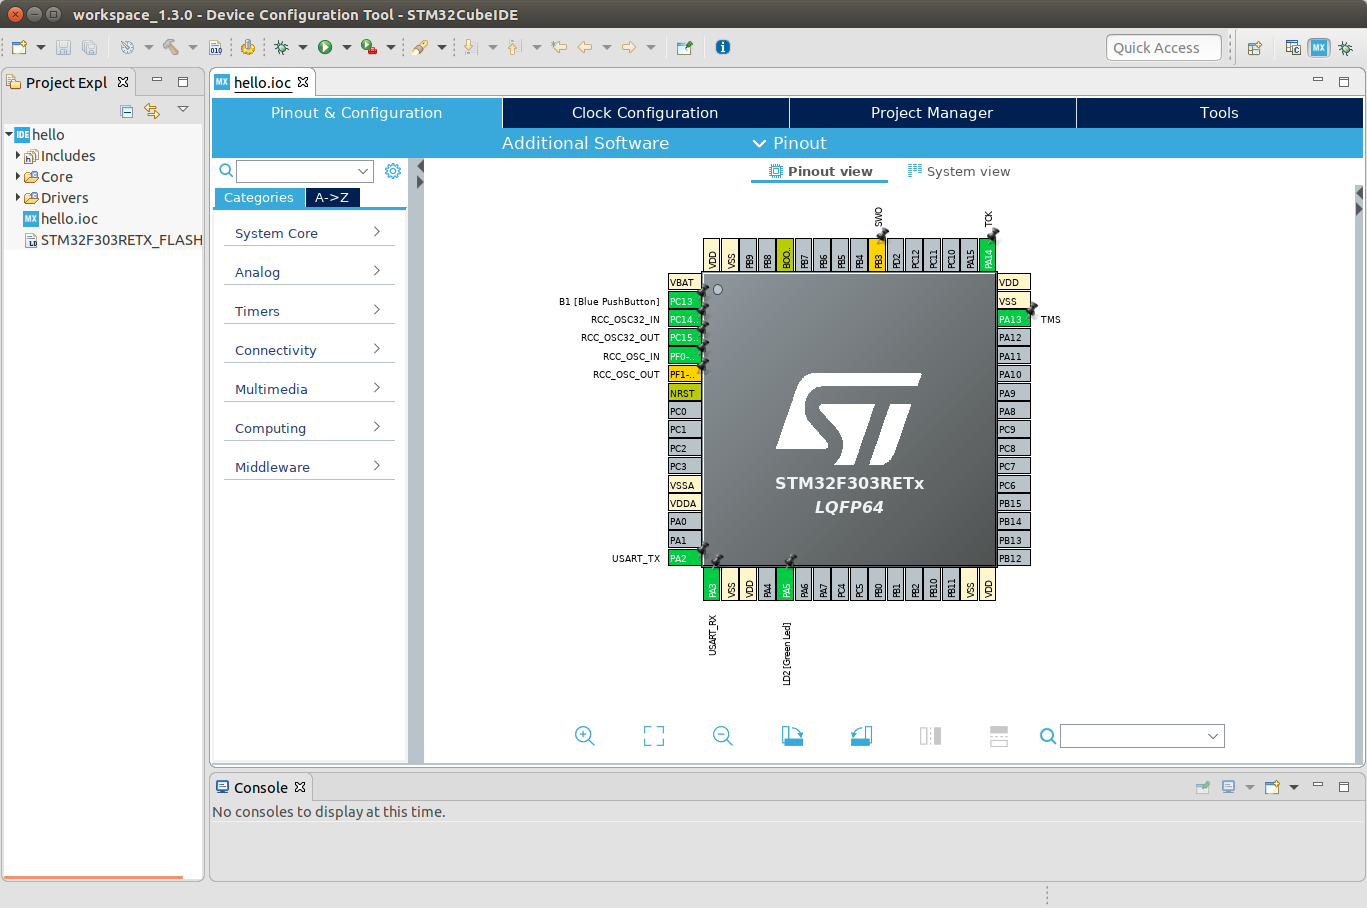
In here, we can set up our peripherals. By choosing yes a moment ago it appears to have pre-populated some settings for me:
- PA5 is LD2, the board’s Green LED
- PC13 is B1, the board’s Blue Push Button
- PA2 and PA3 are a USART
- PB3, PA13/14 are debugging wires
- and PC14/15, PF1/0 are the high and low speed oscillators (I’m not entirely sure why these are enabled by default since my dev kit does not have one of the crystals populated).
Quick pause for a sanity check, let’s open up the schematic for this development board (schematic available in menu to the right of that page). Has it put the LED in the right place?
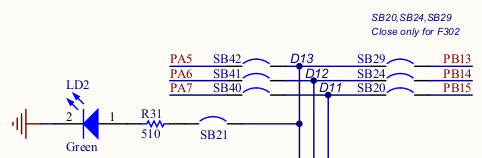
Cool cool. We can check the switch in the same way, and that looks correct as well.
If you click on Clock Configuration in the top menu bar, you’ll now see an intricate clock system diagram:
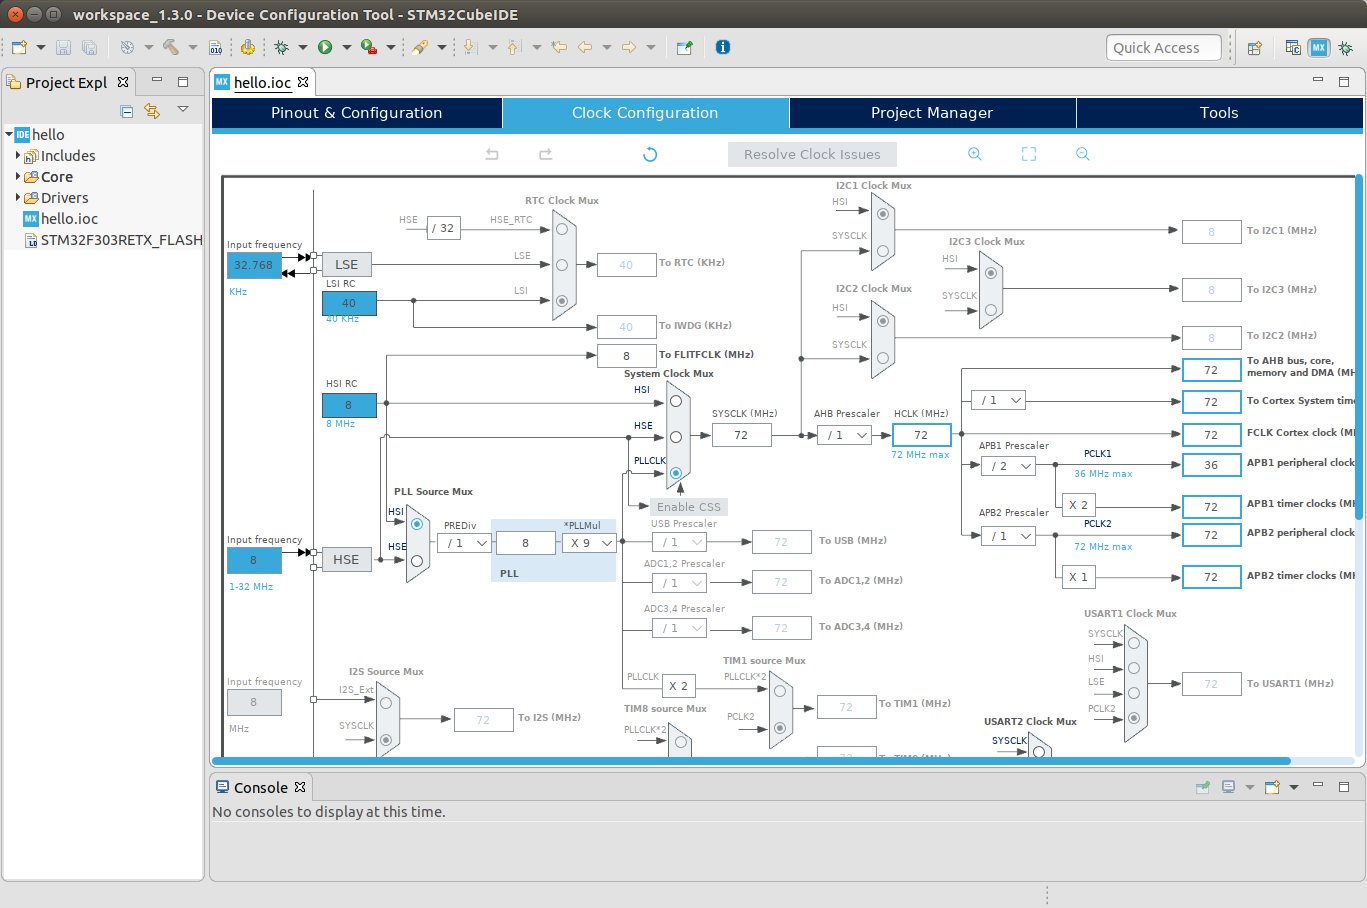
Using the radio buttons embedded into the multiplexers throughout this diagram you can change how different available clock sources propagate through the various PLLs and clock dividers in the device in order to generate all the different frequencies you need.
The default suggestion seems pretty good to me - It’s using the on-chip high and low speed RC clocks, which are perfectly acceptable for little demo applications such as this. Hopefully you can see from this diagram that it’s then using a PLL to multiply the internal 8MHz up to 72MHz. The 72MHz is then passed as-is to everything except the APB1 peripheral bus.
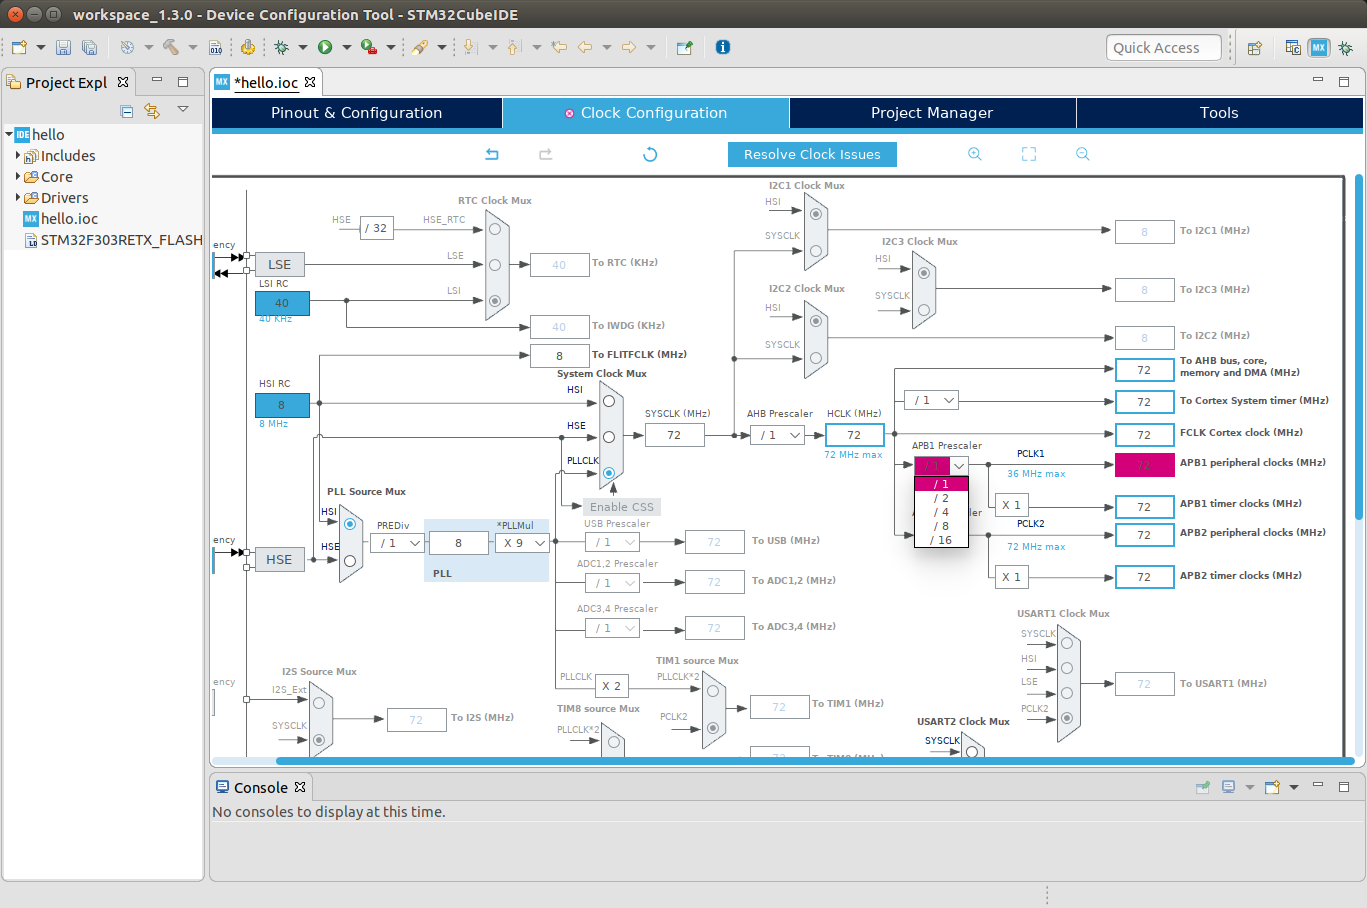
In theory, the clock system does its best to stop you from breaking anything.
Observe, if I change the APB1 divider to /1 instead of /2, the system detects that this will create a faulty system (it exceeds the 36MHz maximum for this bus), and thus flags the inappropriate setting in red.
I returned the setting to the original, and saved. It may ask you if you want to generate code - if you haven’t already done so, hit yes. Now, onto the programming!
Let’s C what we can do here
CubeMX, which this functionality is developed upon, generates C files to work with under a Src directory, and puts a HAL (Hardware Abstraction Layer) into an Includes directory. It appears CubeIDE works the exact same way. Expand the folders on the right under the project view and see what it has generated to work for you:
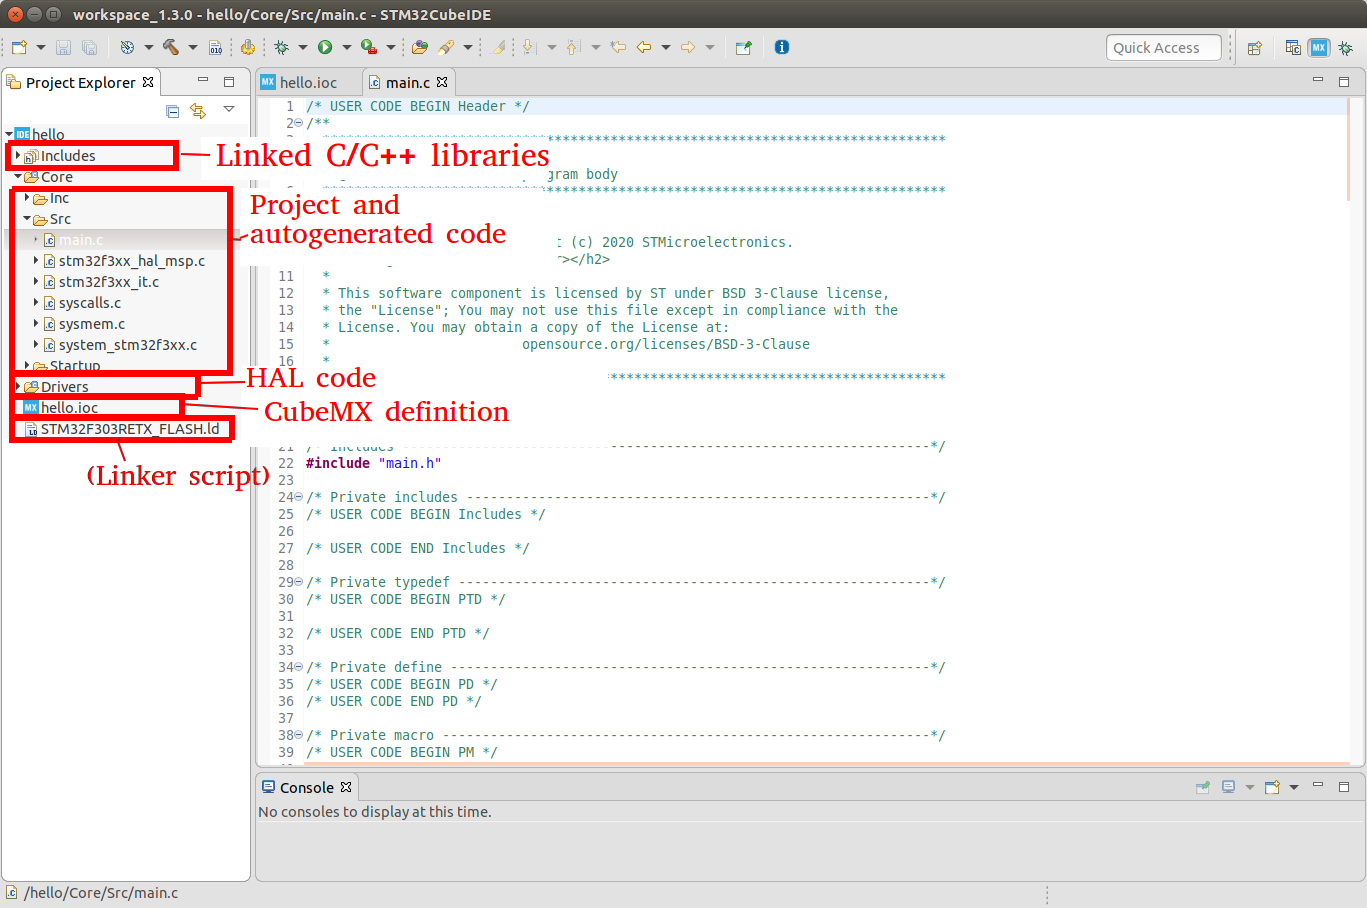
For the purposes of this tutorial we’ll just focus on the main Project and autogenerated code section, starting with main.c.
You’ll see that main.c is already quite large, containing a fair amount of autogenerated code.
A key piece of information to remember here is that main.c can be edited by the code generator, so it’s important to only write code in the USER sections.
What does this mean? Let’s take a look under int main():
int main(void)
{
  /* USER CODE BEGIN 1 */

  /* USER CODE END 1 */

  /* MCU Configuration--------------------------------------------------------*/

  /* Reset of all peripherals, Initializes the Flash interface and the Systick. */
  HAL_Init();

  /* USER CODE BEGIN Init */

  /* USER CODE END Init */

  /* Configure the system clock */
  SystemClock_Config();

  /* USER CODE BEGIN SysInit */

  /* USER CODE END SysInit */

  /* Initialize all configured peripherals */
  MX_GPIO_Init();
  MX_USART2_UART_Init();
  /* USER CODE BEGIN 2 */

  /* USER CODE END 2 */

  /* Infinite loop */
  /* USER CODE BEGIN WHILE */
  while (1)
  {
    /* USER CODE END WHILE */

    /* USER CODE BEGIN 3 */
  }
  /* USER CODE END 3 */
}
Observe in this block of code that there are a number of USER CODE BEGIN and USER CODE END sections marked out by comments.
Any code written inside these blocks is safe and will not be deleted by the code autogenerator.
Any code written outside those blocks is unsafe and will be deleted by the code autogenerator any time you edit the CubeMX settings that we looked at earlier.
Of course, files that you yourself add to the project (e.g. MySuperCFile.c) are also totally safe. It’s just this set of autogenerated .c (and .h) files that you must be careful with when adding code.
Take a brief moment now to look at the function names used in the autogenerated code.
- Any function call beginning with
HAL_is from the STM32 HAL, and is provided in the library files. There’s HAL functions to do all sorts of things, including using the UART, writing a Pin, etc. - Any function call beginning with
MX_is autogenerated by CubeMX/CubeIDE. These functions tend to be used to initialise functions. - There are exceptions to these rules, including, annoyingly,
SystemClock_Config(), which is also an autogenerated function.
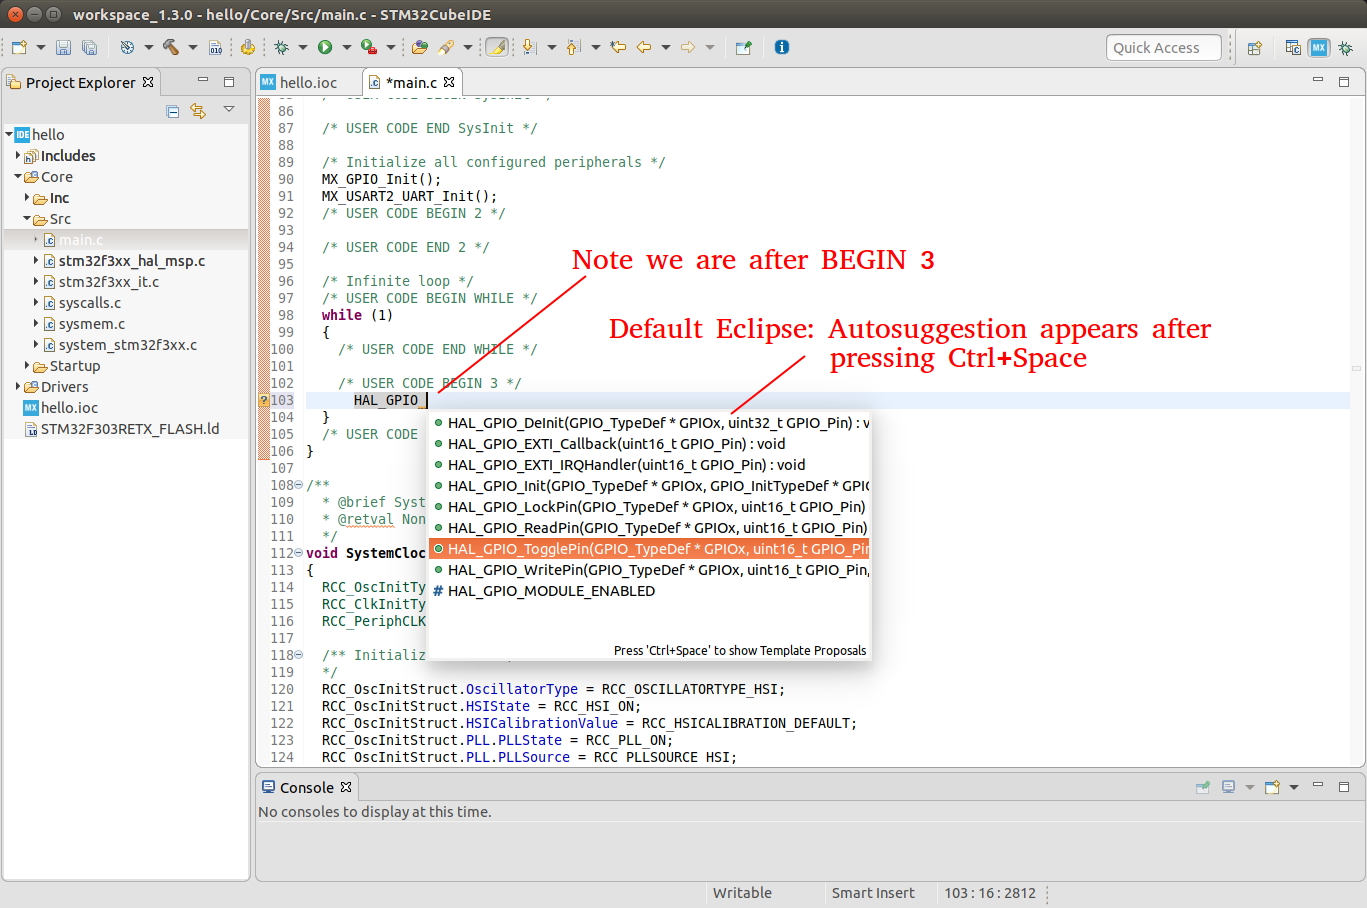
Let’s add a smidge of C code of our own now! After the Infinite Loop area, we’re going to add code to toggle the LED under section 3.
I initially couldn’t get the autosuggest to show up on its own, but then worked out it appears after you press Ctrl+Space:
We’re going to change the overall loop to:
  /* Infinite loop */
  /* USER CODE BEGIN WHILE */
  while (1)
  {
    /* USER CODE END WHILE */

    /* USER CODE BEGIN 3 */

    //Here's my new code that I've added to toggle the Green LED (LD2)
    HAL_GPIO_TogglePin(LD2_GPIO_Port, LD2_Pin);
    HAL_Delay(1000);
  }
  /* USER CODE END 3 */
}
Note the following:
- Indentation by the code generator is 2 spaces per level (It’s not my favourite, but you do get used to it)
- I’ve put my code only inside section 3
- Under the CubeMX view, the Led GPIO pin was named LD2 - observe how a name has automatically been generated for both the Pin and the Port
- I’ve used two HAL functions, one to toggle a GPIO pin, and one to cause a delay of 1000 milliseconds.
Alright! This tiny project is all we needed to blink that on-board LED at around once per second. What’s next?
Compiling the project and downloading it to the board
STM32CubeIDE actually makes it pretty easy to compile our work and get it onto the STM32 chip.
We only need to tell it what we want to do once, right at the start, and every subsequent time it will copy what we asked.
The first step is to produce the first version of the compiled .elf (a binary version of our code).
We need this .elf so that we can point the download tool to it.
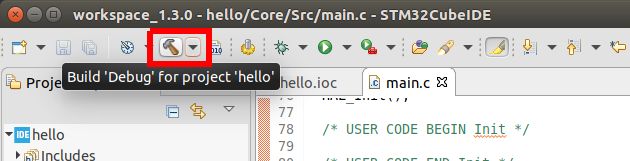
To generate the .elf, we need to do a build.
This is as easy as pressing the build button on the toolbar:
Now, build information is presented in the console at the bottom of the screen:
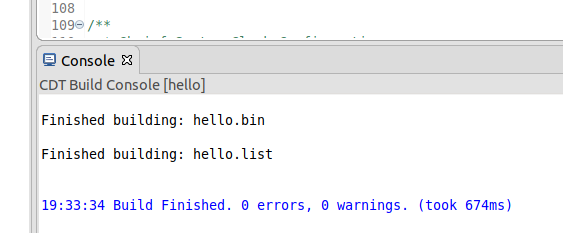
Excellent.
Now what we want to do is send this compiled binary onto the STM32 microcontroller.
Let’s plug in the dev kit:
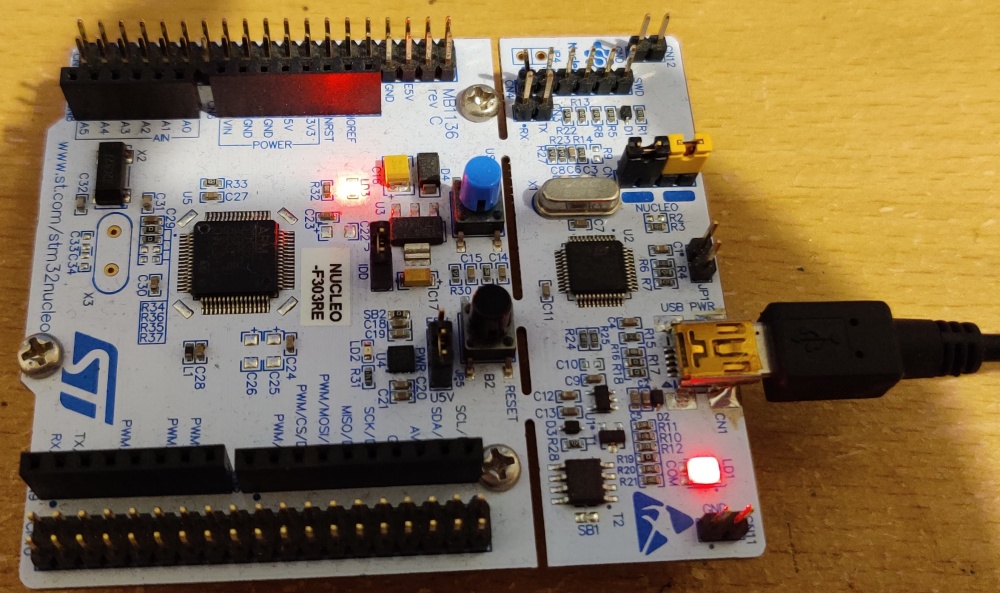
The Red power LED (to the left of the blue switch) is lit, as is the larger communication LED (by the USB cable). Not much else is happening - that’s fine though, we’ll soon get a bit more going.
Inside STM32CubeIDE, select the run button:
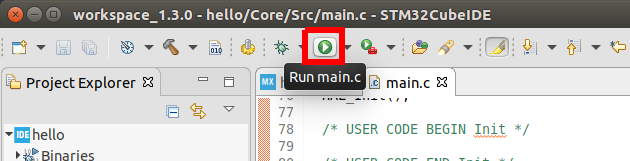
This will open the Run dialog (as it’s the first time we’ve run it). The settings we choose now will be saved as a run configuration which we can re-use or edit later.
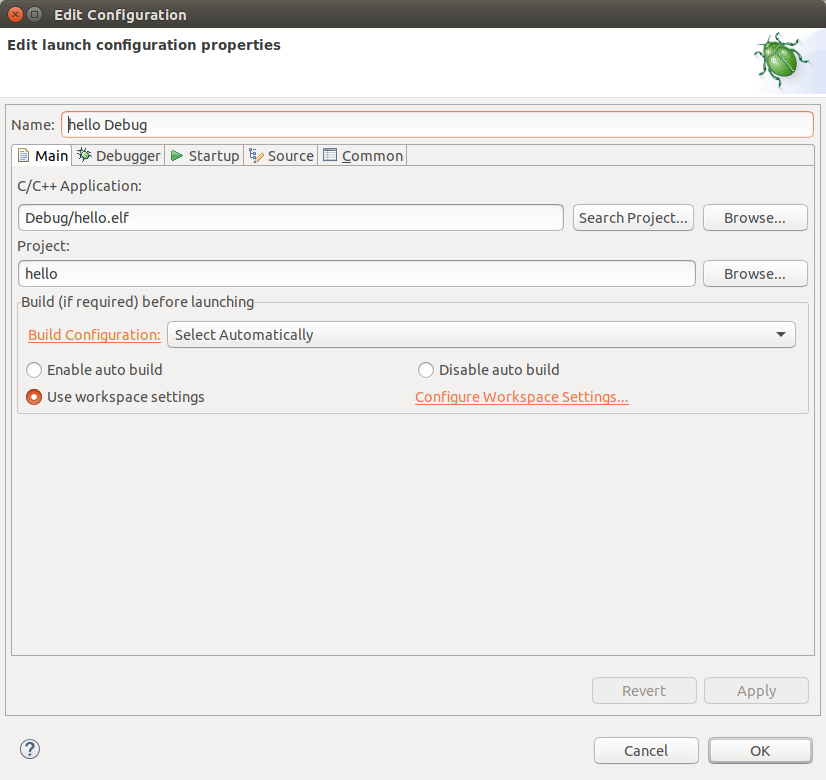
Fortunately, the default settings (at least on Ubuntu) are perfect for this tutorial, so we don’t need to change anything. Feel free to take a look under the other tabs (the debugger one is interesting - note how it expects to be using the SWD interface, which was some of the pins that were set by default under the CubeMX project when we first created a project for our board).
Simply press Apply and then OK and the download will proceed.
The Console will now fill with some interesting text:
STMicroelectronics ST-LINK GDB server. Version 5.5.0
Copyright (c) 2019, STMicroelectronics. All rights reserved.

Starting server with the following options:
        Persistent Mode            : Disabled
        Logging Level              : 1
        Listen Port Number         : 61234
        Status Refresh Delay       : 15s
        Verbose Mode               : Disabled
        SWD Debug                  : Enabled
        InitWhile                  : Enabled

Waiting for debugger connection...
Debugger connected
      -------------------------------------------------------------------
                        STM32CubeProgrammer v2.4.0
      -------------------------------------------------------------------

ST-LINK SN  : 0665FF544854677567204528
ST-LINK FW  : V2J36M26
Voltage     : 3.28V
SWD freq    : 4000 KHz
Connect mode: Under Reset
Reset mode  : Hardware reset
Device ID   : 0x446
Device name : STM32F302xE/F303xE/F398xx
Flash size  : 512 KBytes
Device type : MCU
Device CPU  : Cortex-M4

Memory Programming ...
Opening and parsing file: ST-LINK_GDB_server_WzeTJx.srec
  File          : ST-LINK_GDB_server_WzeTJx.srec
  Size          : 11032 Bytes
  Address       : 0x08000000

Erasing memory corresponding to segment 0:
Erasing internal memory sectors [0 5]
Download in Progress:

File download complete
Time elapsed during download operation: 00:00:00.793

Verifying ...

Download verified successfully

Debugger connection lost.
Shutting down...
Interestingly, I didn’t get the option to choose a board or USB port or anything during this process, it all just happened automagically, so I’m not sure what would happen if you had multiple ST dev boards / ST-LINK programmers connected all at the same time.
At any rate, my dev kit’s communication LED lit up during this time, and after that it seems that the board is running the program!
(Yes, I went to the effort of recording, editing, and compressing a 2 second video of a blinking LED).
It really is as easy as that - you’ve got everything set up now.
Any new code from here, you simply just need to hit the run button - it will compile it for you automatically.
Debugging execution
Tooling for analysing and debugging embedded systems largely comes in two main categories. The first of these is in the hardware domain: tools like oscilloscopes, logic analysers, datasheets, and horrifying math equations. These can all work together to help you benchmark your systems and solve issues with your designs. These tools are frequently used.
The second category of tools focuses on software debugging, with breakpoints, watch lists, trace analysers, and so forth. These all work together to help you diagnose and understand what your embedded software is doing. Yet, it has been my experience that these formal tools are much less frequently used - even though there is a trend throughout industry to integrate more and more software into our designs. Instead, designers rely on simpler ‘tried-and-true’ approaches such as blinking LEDs or outputting debug messages to UART peripherals. Now, it’s not to say that these techniques don’t work - they do, given time! - but they can often get in your way and be a major barrier to understanding when trying to diagnose why something is or is not working.
It’s hard to say why the proper tooling for software debugging gets less attention than the proper tooling for hardware debugging. Perhaps it is because there is a lack of awareness of the tools and their capabilities. Perhaps they are not properly taught in our apprenticeships and academic institutions. Perhaps it is because historically these tools have been fiercely difficult to use with high barriers to entry.
At any rate, the state of the art these days for software debugging tools seems to be pretty good, with reasonably well made and accessible tooling available for us to use. STM32CubeIDE seems to be no exception, and in this section, I aim to introduce you to some of the things we can do with its integrated debugger.
Note: You may need to enable debugging via your CubeMX config. I had it enabled already since it’s included in the default configuration for my development board. If you need to enable it, do this in the CubeMX view:
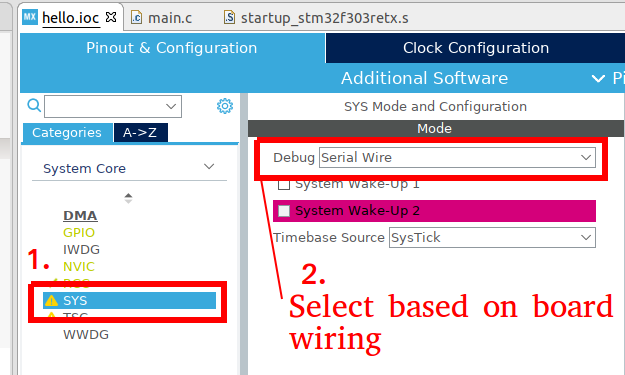
Save your config using File>Save and regenerate the code.
Let’s have a play by debugging our code! But first, let’s add something to debug, since there’s not much going on here. I choose to add a few snippets of code to calculate some prime numbers!
Thus, I’m going to add a few lines of code to a few of those USER code blocks in main.c, as detailed here:
// . . .

/* USER CODE BEGIN Includes */
#include <stdbool.h>
/* USER CODE END Includes */

// . . .

/* USER CODE BEGIN PD */
#define PRIMES_LEN 62
/* USER CODE END PD */

// . . .

/* USER CODE BEGIN PV */
uint16_t primes[PRIMES_LEN] = {0};
/* USER CODE END PV */

// . . .

/* USER CODE BEGIN 0 */

//check if a number is prime
bool is_prime(uint16_t v) {
  for(uint16_t i=2; i<(v/2 + 1); i++) {
    if(v % i == 0) return false;
  }
  return true;
}
/* USER CODE END 0 */

// . . . (inside int main())

  /* USER CODE BEGIN 2 */

  //calculate a list of primes:
  uint16_t prime_index = 0;

  for(uint16_t i = 2; i < 300; i++) {
    if(is_prime(i)) {
      primes[prime_index] = i;
      prime_index++;
    }
  }

  /* USER CODE END 2 */
Okay! If we compile and execute this, we won’t observe any changes (except for maybe the slightest of delays before the LED starts blinking the first time). So how do we know if the list of primes is correct?
Well, how about we just ask the debugger? Let’s give it a go!
Let’s first look at the end result, and then look at observing the looping calculation using a breakpoint.
Intro to Debug mode, resume, suspend, and watch variables
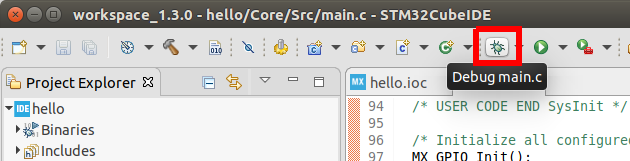
To simply observe the end result, we launch the program using the Debug mode, with the Debug button.
Firstly, you’ll see STM32CubeIDE change into its debug perspective. You may get a popup asking you about this.
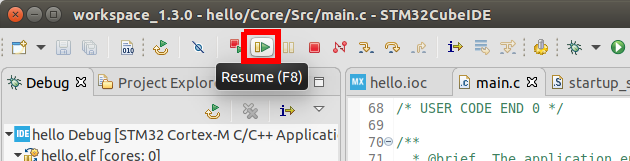
You’ll notice that the dev kit in front of you has the communication LED blinking continously, but that the user LED isn’t blinking yet. This is because the program is not actually running yet. In order to run the program, we need to press the ‘Resume’ key, which will get us started: (the resume key, as well as the other debug control keys, will have appeared due to the debug perspective activating).
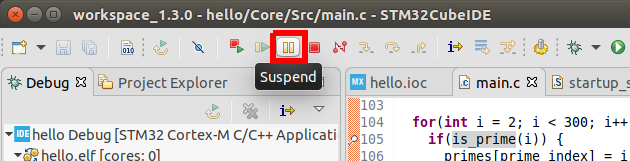
Once you notice the dev board’s LED light is blinking, pause the execution by pressing the suspend key:
You’ll notice that the IDE immediately throws you somewhere in the C code for your project - almost certainly in somewhere to do with the HAL_Delay function. That’s where your program was when you hit suspend!
We can get back home by going to the left Debug panel and selecting main().
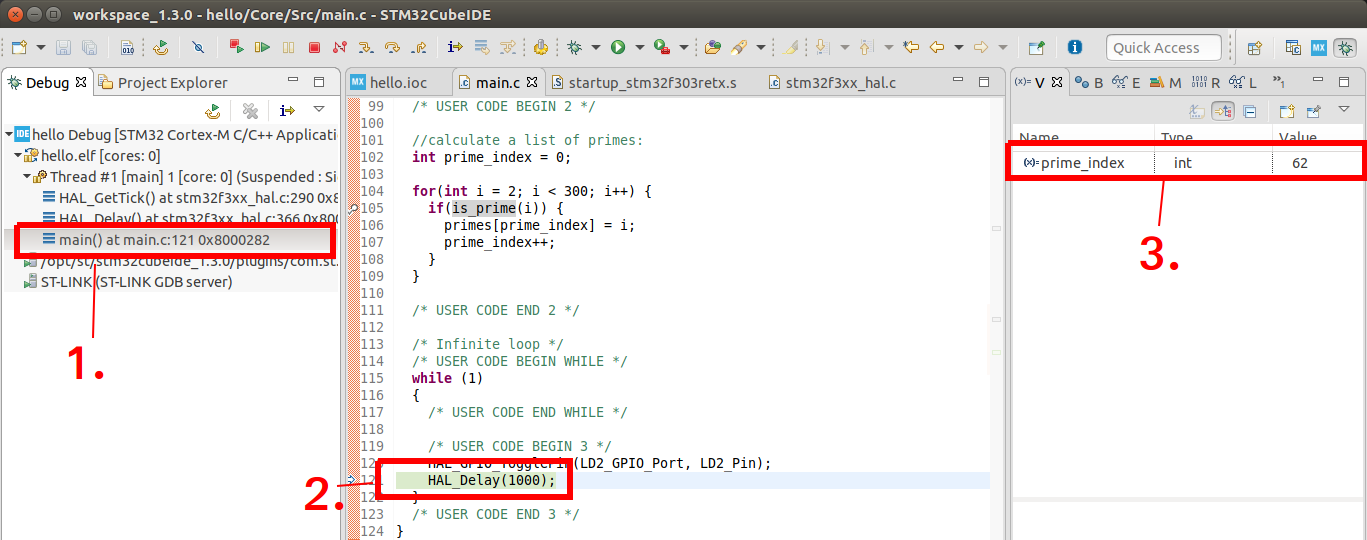
Note that the IDE highlights the function that is currently being executed (2) as well as presents a list of variables in the current scope (3).
We can also examine the contents of our global variable by double clicking it:
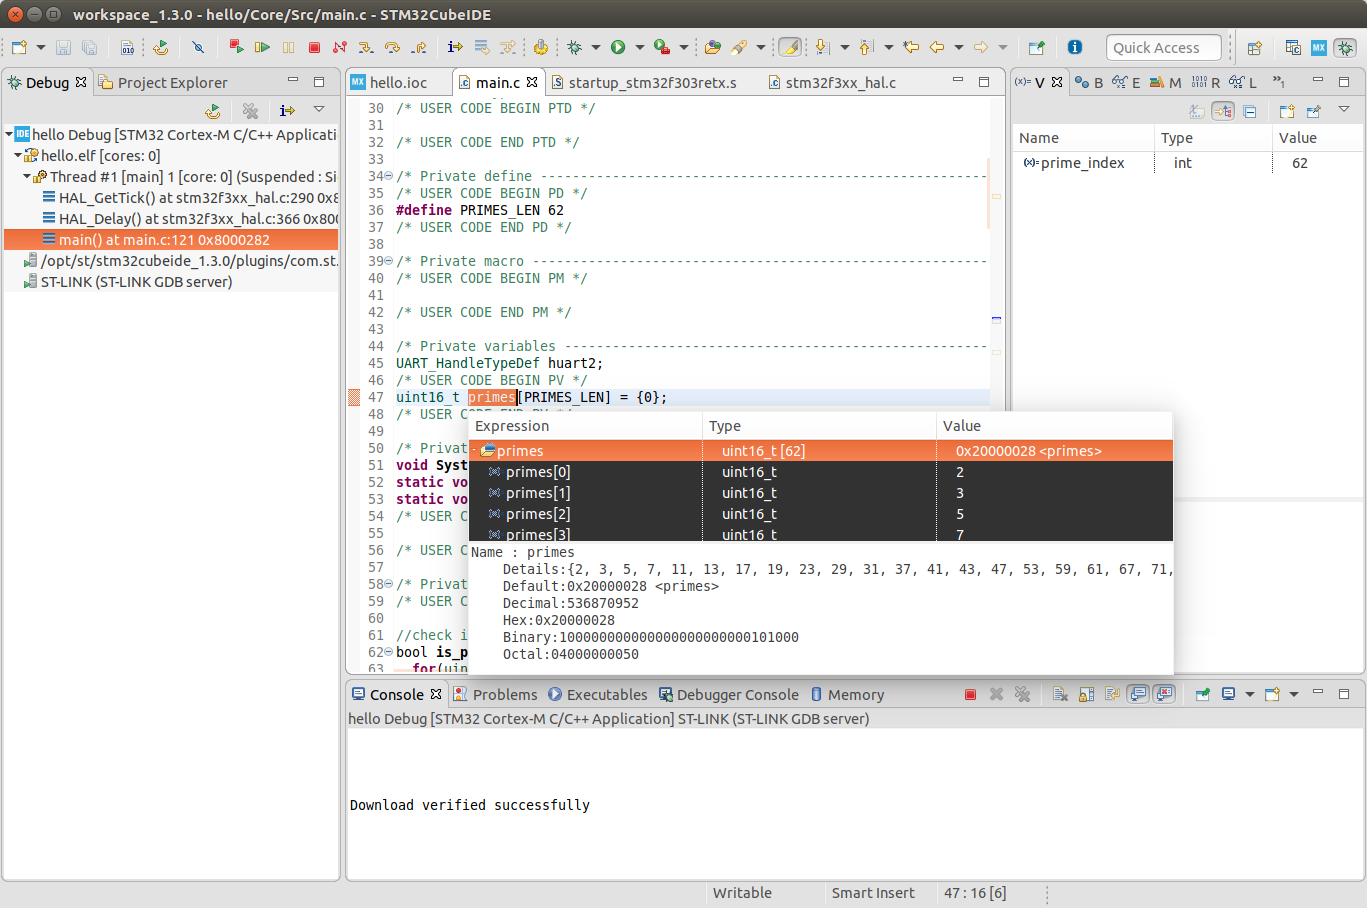
Or in a more convenient manner (since this is a big array) by right clicking on the variable primes and selecting Add Watch Expression (and then pressing OK)
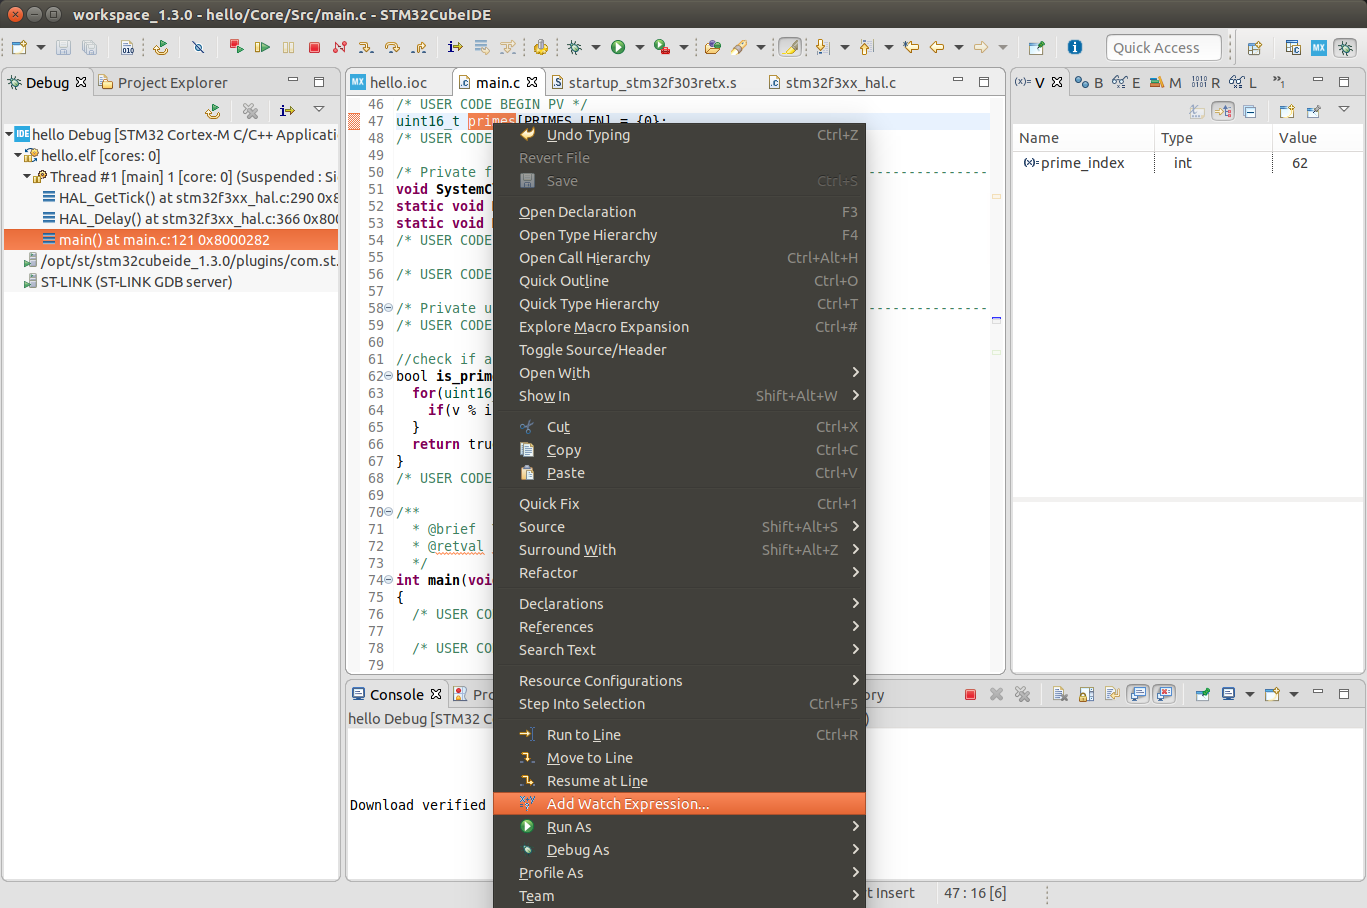
That then adds it to the Expressions menu on the right (I’ve expanded it for this screenshot):
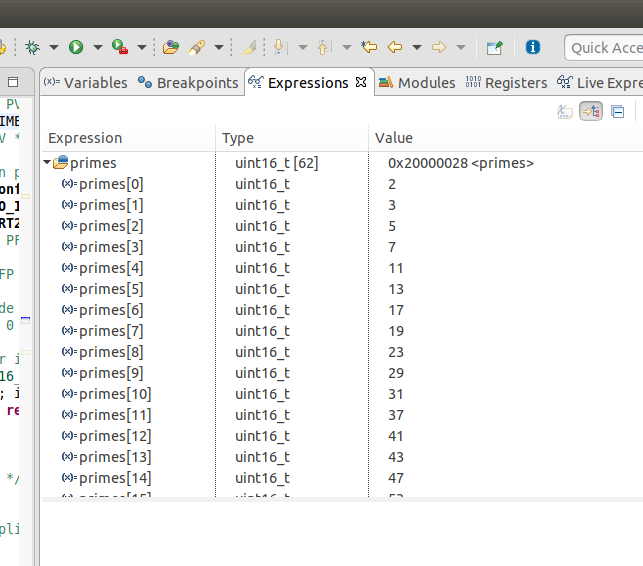
That’s really cool! Press the Red Stop button now in the top menu, and we’ll have a go at watching execution of the prime calculation loop.
Breakpoints
In addition to running and suspending execution, we can also ask the program to suspend at a point of our choosing. This is known as creating a breakpoint.
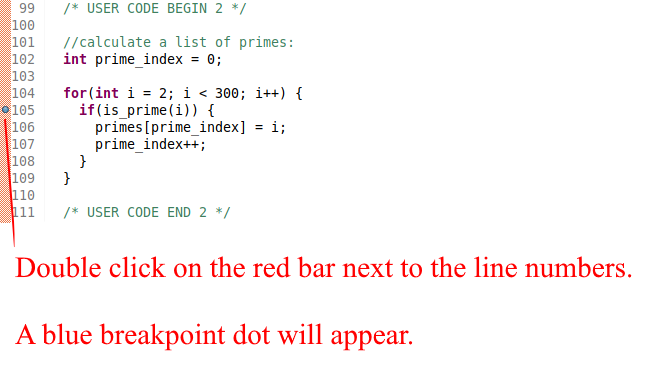
In STM32CubeIDE you do this by double clicking on the red bar next to the line numbers, which will cause a small blue breakpoint indicator dot to appear.
Now, without changing anything else, launch the debug mode again.
This time, when you hit resume, you’ll notice that the program executes and then automatically halts when it reaches your breakpoint.
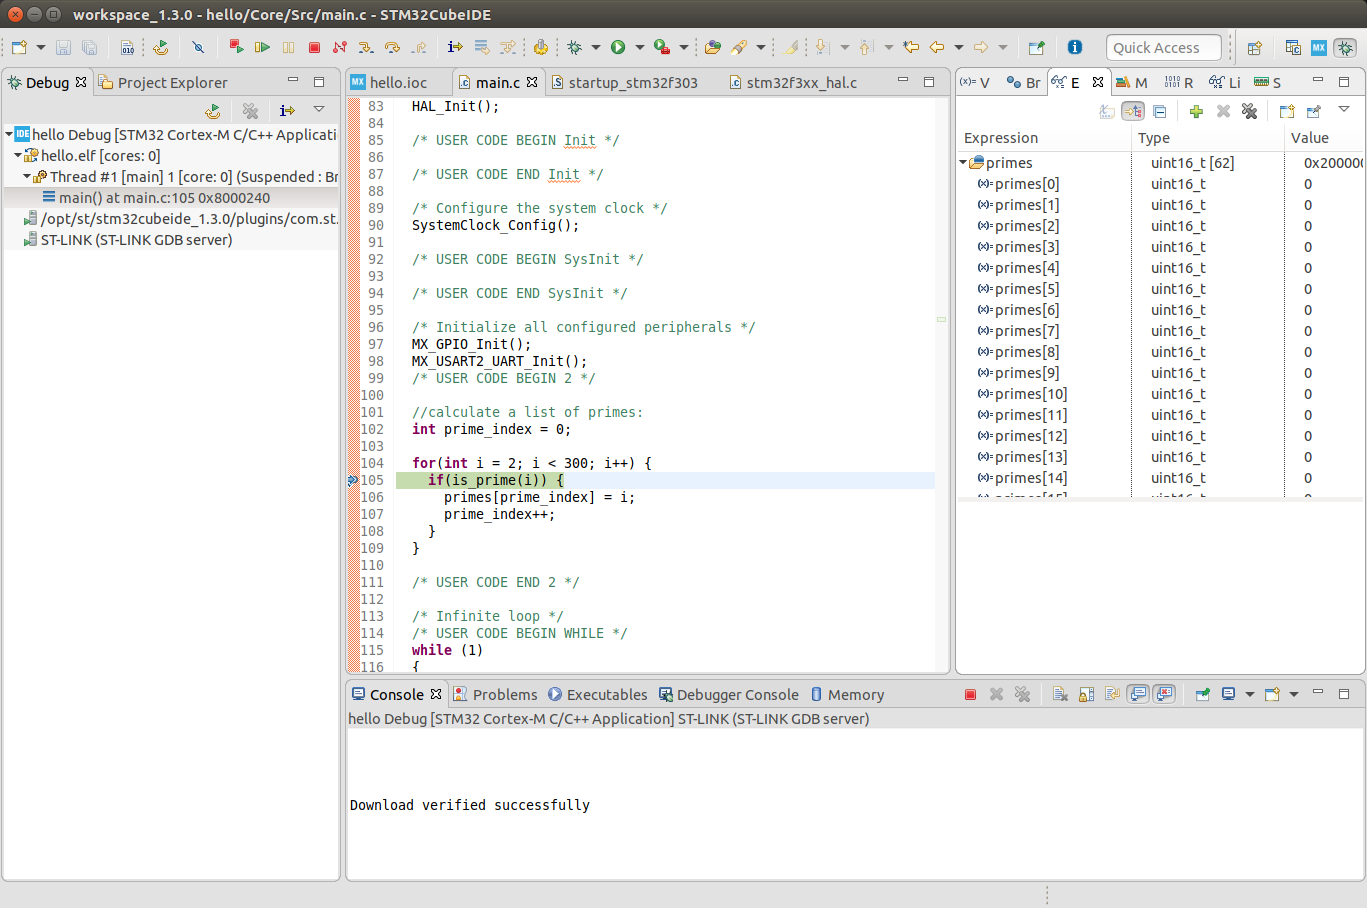
Now if I press suspend again, it will loop and stop at this same function. And, oh, what’s this?
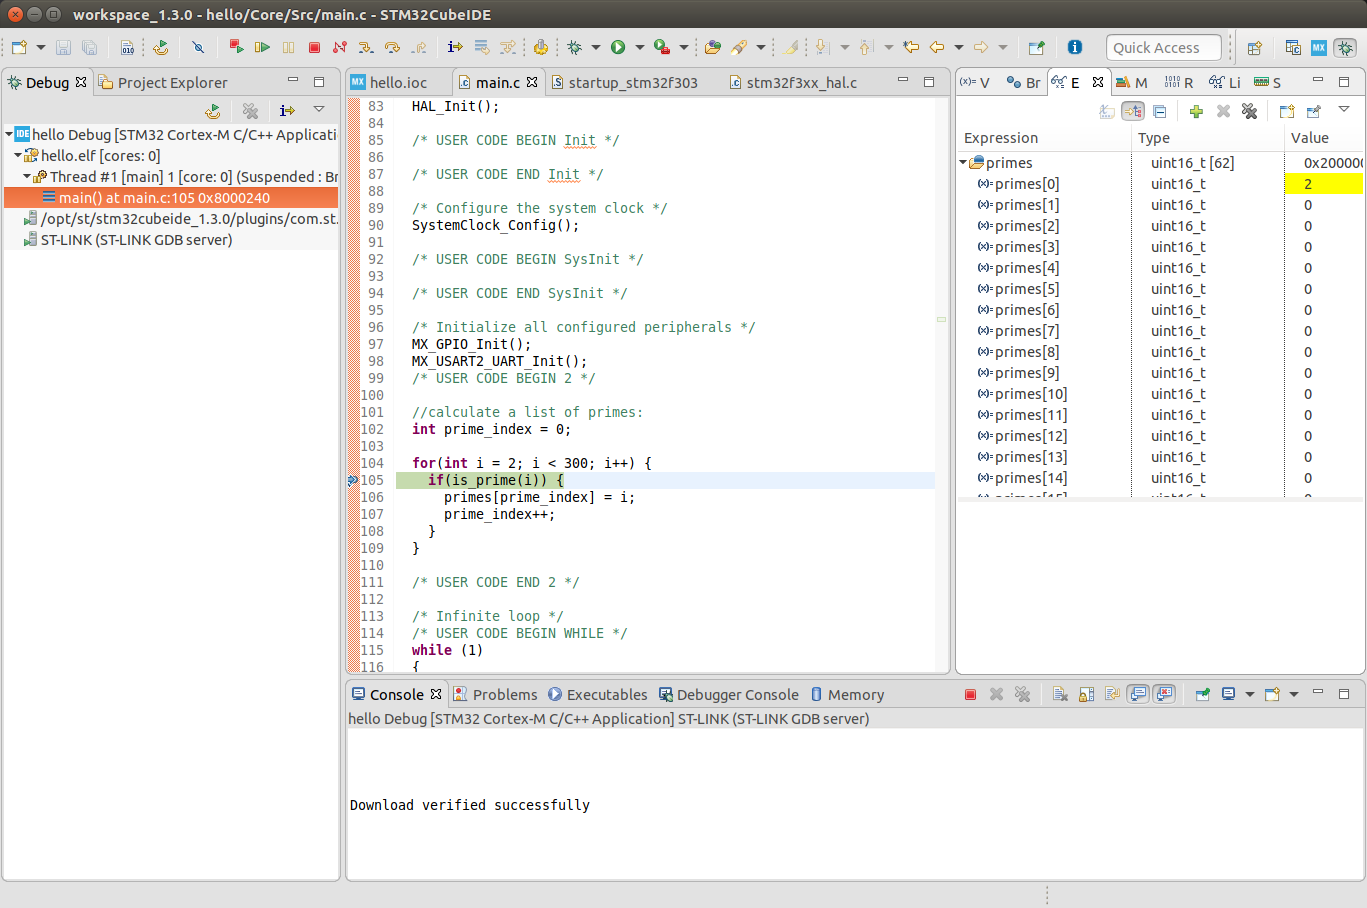
The first index of primes has changed, and it’s highlighted the changed variable!
Let’s hit resume again:
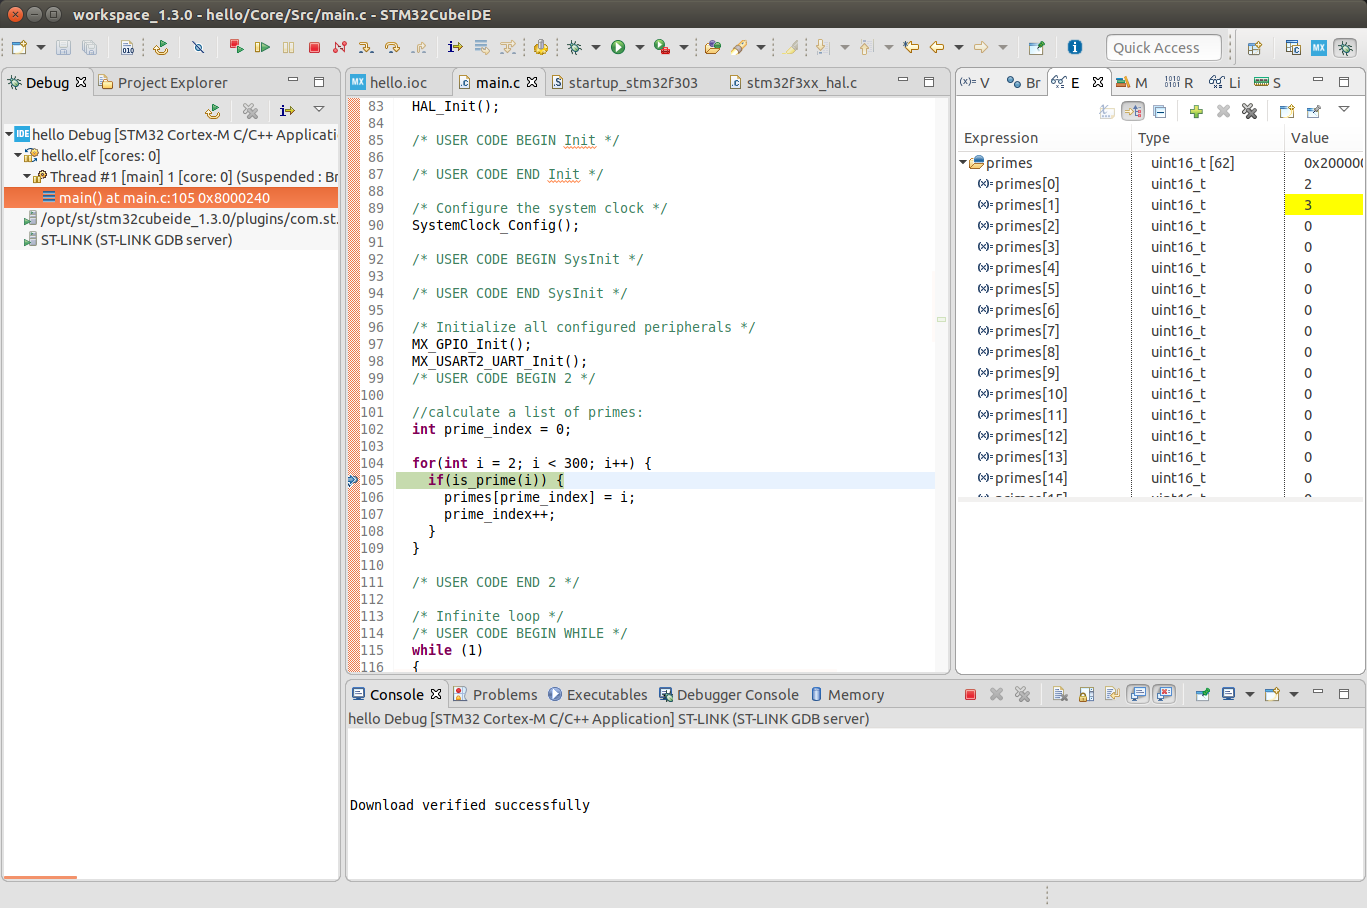
Now the second index of primes has changed, and the changed variable is highlighted once more!
You can keep pressing the resume button and you’ll see it slowly calculate the array.
Let’s now quit the debugger and move on. You can delete the breakpoint again by double clicking the blue dot. Note that if you right click on the red column, you can also toggle and create breakpoints this way. This also brings up advanced breakpoint options, including breakpoint conditions and breakpoint types.
The debugger SWO
If properly configured, you can output arbitrary strings directly to the debugger via the programmer, rather than sending them via any other peripherals. It’s a bit like a virtual UART that you can send data to.
This is a little involved to set up, and it can be worth simply using a UART if you must send out strings of characters to help your debugging, but I’ll step through the basics here using STM32CubeIDE.
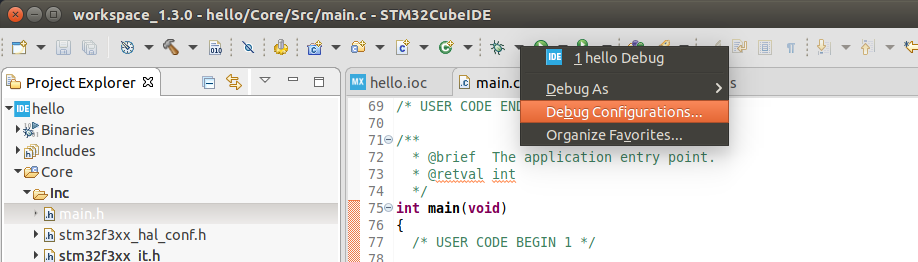
First, we must configure the reception clock rate. We do this via the debug configuration menu.
Press this:
Go to the Debugger tab, Enable SWV (Serial Wire Viewer), then change your clock rate to the FCLK from earlier (remember when we chose the clock rate for all of our components?)
You may leave the SWO Clock drop down set to its maximum.
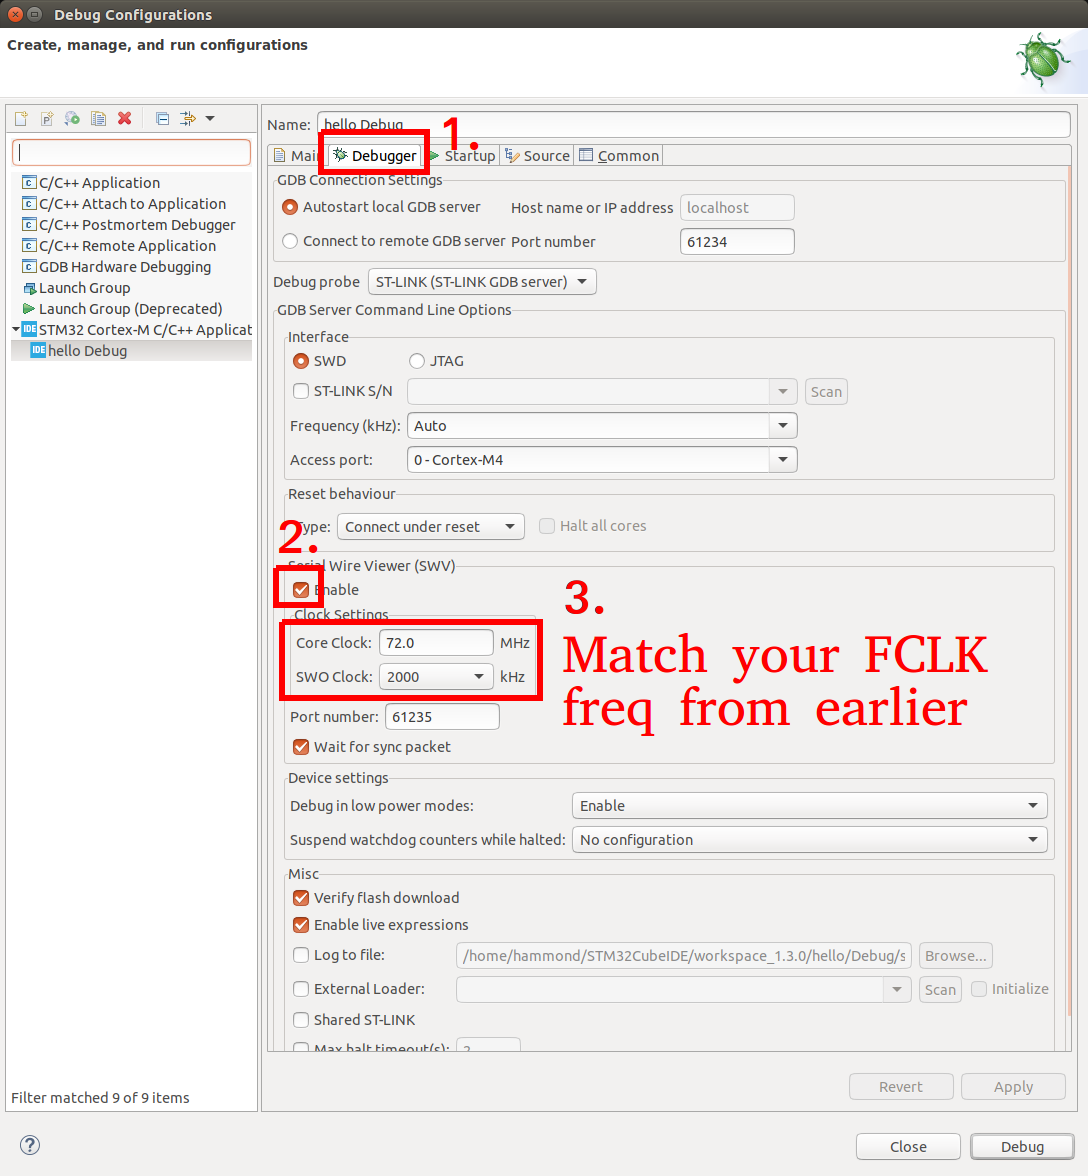
Now press Apply/Close.
Let’s add a test to send some characters. In the main loop, add the following:
  /* Infinite loop */
  /* USER CODE BEGIN WHILE */
  while (1)
  {
    /* USER CODE END WHILE */

    /* USER CODE BEGIN 3 */
    HAL_GPIO_TogglePin(LD2_GPIO_Port, LD2_Pin);
    HAL_Delay(1000);
    ITM_SendChar('!');
  }
  /* USER CODE END 3 */
ITM_SendChar is a special function which sends a character to the debugger’s serial viewer. You shouldn’t need to #include anything new or special to use this.
You can now launch the debug session as before. But, before you press Resume to get it started, we need to enable a few more debugging options.
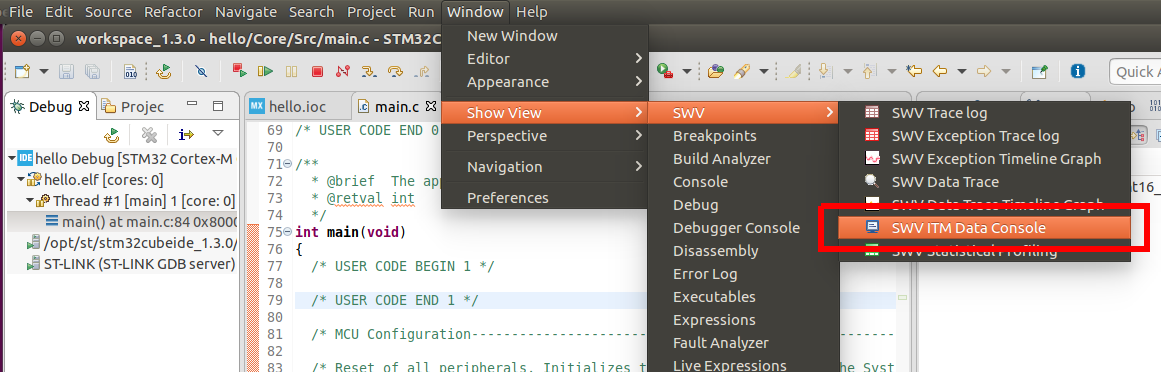
First, open the ITM data console through the Window menu:
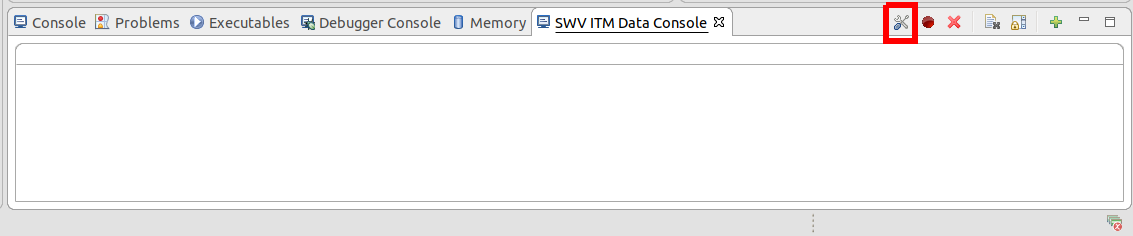
This will bring up the ITM data console window. Now, enter the configuration menu:
Enable ITM stimulus port 0:
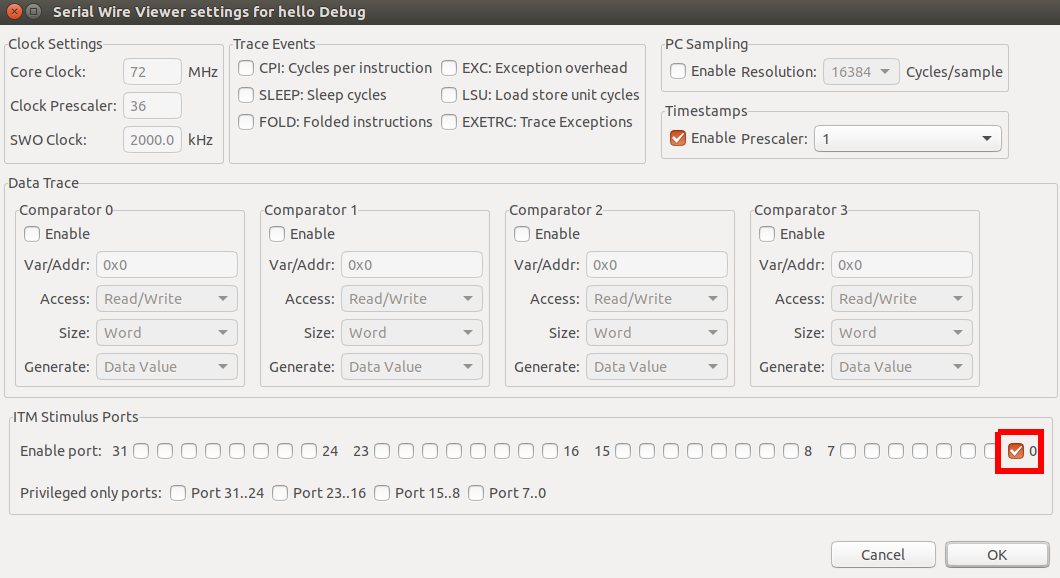
Press OK.
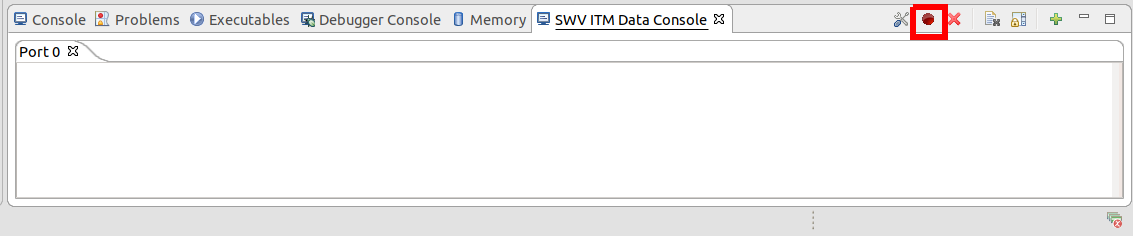
Port 0 will appear in the console view. Now press Start - this actually contacts your microcontroller and adjusts some registers internally to enable this mechanism:
Now, and only now, can you press Resume. You’ll notice your Port 0 terminal slowly start filling with exclamation marks (since that’s the character we’re sending!)
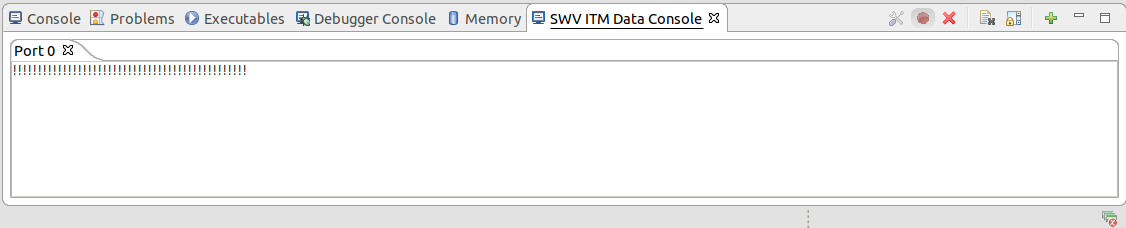
As you can imagine, this is pretty handy when your design might not have a free UART for debugging.
Without too much difficulty, we can also spin up a custom printf function for debugging. There’s a few options for this, but my preferred approach is to actually create my own debug_printf function, like so:
Adding more to main.c, as detailed:
// . . .
/* USER CODE BEGIN Includes */
#include <stdbool.h>
#include <stdio.h>
#include <stdarg.h>
/* USER CODE END Includes */
// . . .
/* USER CODE BEGIN PD */
#define PRIMES_LEN 62
/* USER CODE END PD */
// . . .
/* USER CODE BEGIN PV */
uint16_t primes[PRIMES_LEN] = {0};
/* USER CODE END PV */
// . . .
/* USER CODE BEGIN 0 */
//check if a number is prime
bool is_prime(uint16_t v) {
// . . .
}
//debug_printf sends a max of 256 characters to the ITM SWO trace debugger
//It uses a _variable length argument_, same as normal printf
//Indeed, just call this function as if it was printf, and you'll get the behaviour you expect
//I also like doing it this way since I can change the definition of the function as needed
void debug_printf(const char *fmt, ...) {
char buffer[256];
va_list args;
va_start(args, fmt);
vsnprintf(buffer, sizeof(buffer), fmt, args);
va_end(args);
uint16_t i = 0;
while(buffer[i] != '\0') {
ITM_SendChar(buffer[i]);
i++;
}
}
/* USER CODE END 0 */
// . . . (inside int main())
/* Infinite loop */
/* USER CODE BEGIN WHILE */
uint32_t count = 0;
while (1)
{
/* USER CODE END WHILE */
/* USER CODE BEGIN 3 */
HAL_GPIO_TogglePin(LD2_GPIO_Port, LD2_Pin);
HAL_Delay(1000);
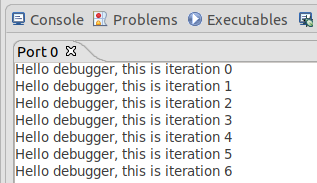
debug_printf("Hello debugger, this is iteration %d\r\n", count);
count++;
}
/* USER CODE END 3 */
Now we save, build, and debug that. Remember to Start the ITM trace before pressing Resume!
The ST-Link Virtual COM Port
The very last thing I want to talk about today is a neat feature included in my Nucleo board. The inbuilt ST-Link v2.1 interface that we’ve been using for programming and debugging also includes a virtual COM port. As of the time of this tutorial, the COM port uses drivers which are included natively in most operating systems (including Windows and Ubuntu Linux).
Indeed, if I run dmesg | grep tty in my terminal, I can see it has been made available as /dev/ttyACM0 thus:
$ dmesg | grep tty
[30318.354183] cdc_acm 3-10.4:1.2: ttyACM0: USB ACM device
This is really handy for your user applications, as this virtual COM port is wired directly onto one of the USART peripherals on the nucleo board! Recall from the CubeMX view that pins PA2 and PA3 were automatically configured as a USART for us.
A quick sanity check to make sure this makes sense by looking on the schematic:
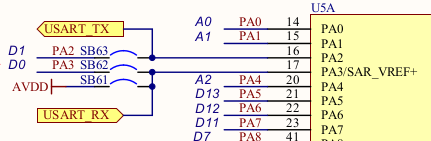
Sure looks like they’re connected to a USART (and indeed, tracing it through the rest of the schematic shows them connected to the ST-Link V2 programmer). So let’s quickly jump back into the CubeMX view and see how the port was set up:
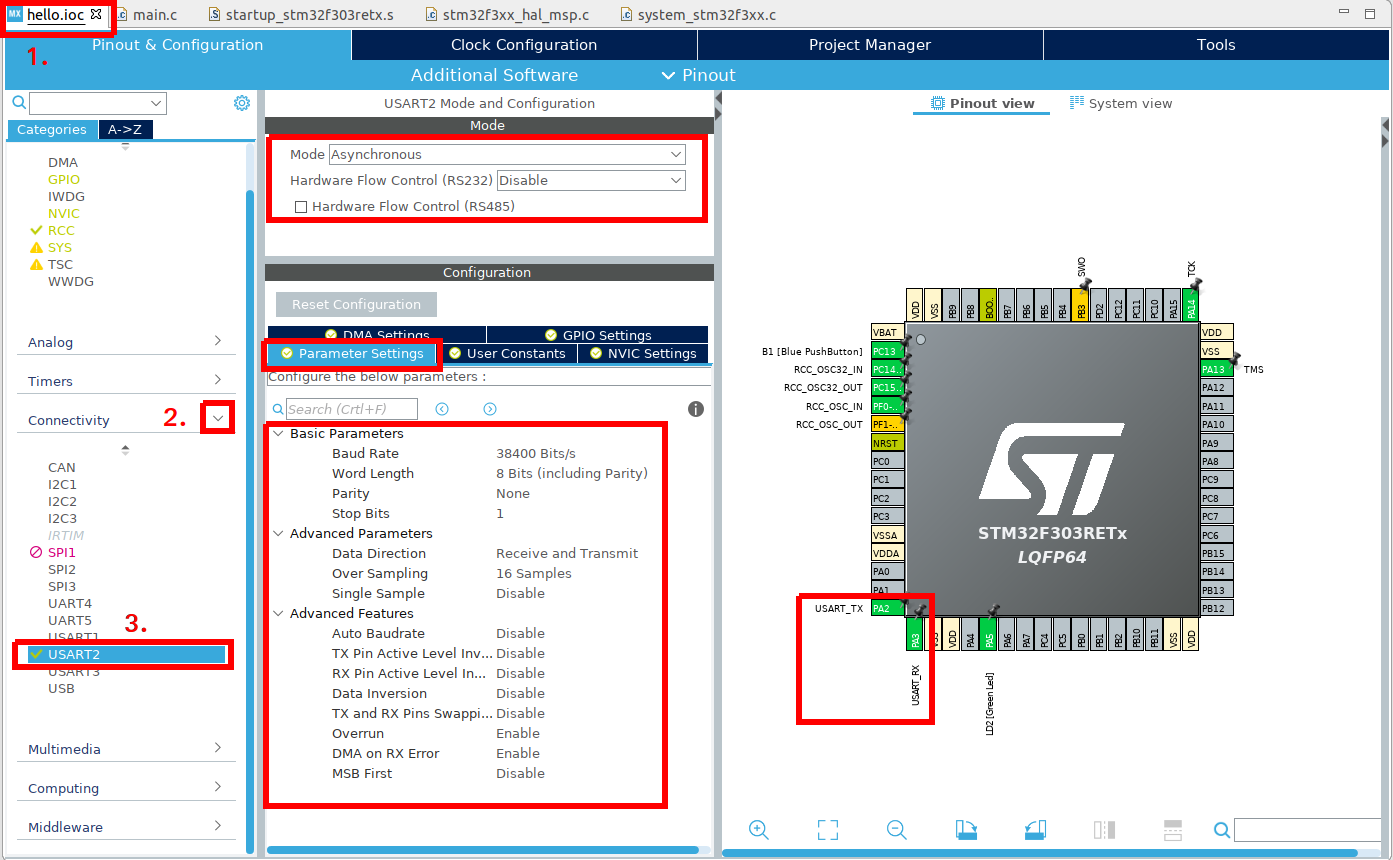
It’s configured as asynchronous, at 38400 baud, 8 data bits, no parity, 1 stop bit.
We could change these settings now if we wanted to. The virtual COM port works the same as any other USB to serial adapter, and so any baud rate and config can work with it. For now I’m happy with the defaults though.
Let’s have a go at sending some characters to it.
  /* Infinite loop */
  /* USER CODE BEGIN WHILE */
  uint32_t count = 0;
  while (1)
  {
    /* USER CODE END WHILE */

    /* USER CODE BEGIN 3 */
    HAL_GPIO_TogglePin(LD2_GPIO_Port, LD2_Pin);
    HAL_Delay(1000);
    debug_printf("Hello debugger, this is iteration %d\r\n", count);
    HAL_UART_Transmit(&huart2, (uint8_t*)"Hello world, this is a UART\r\n", 30, 1000); //30 is the number of characters, 1000 milliseconds timeout
    count++;
  }
  /* USER CODE END 3 */
We now build and download that, before running Minicom:
$ minicom -b 38400 -D /dev/ttyACM0
And here’s the output:
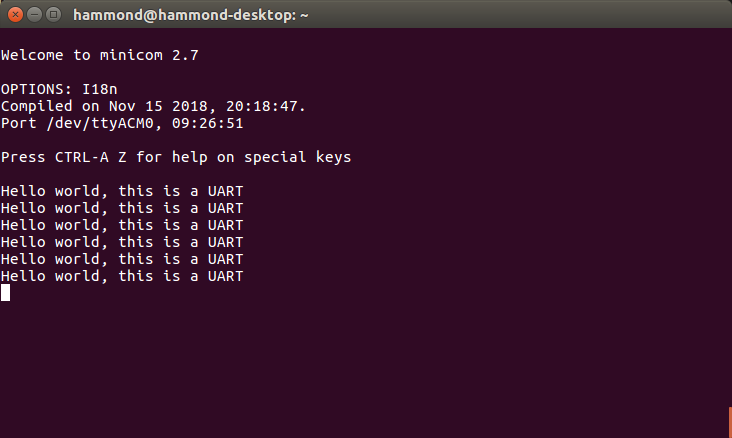
If we wanted, we could now make a usart_printf like our debug_printf from earlier, but I’ll leave that as an exercise for the reader.
Conclusions
Hopefully across this tutorial you’ve managed to gain some familiarity with the tools and environment available for your STM32-based device. My intention was to show you a little bit of everything! Now that you know how to make a project and get code working, why not try out some of the features of your microcontroller?
- Have a go at reading the input push button
- Try out timer interrupts or timer PWM to get a true 1 second LED blink
- Have a go at using USART with DMA (direct memory access)
In addition, practice your C a little more:
- Split functionality out into multiple files so you don’t need to worry about the code autogenerator deleting things
- Practice string manipulation (maybe make a basic chatbot which sends and receives via UART?)
- Try out pointers to functions (rather than pointers to variables) and have a google of dependency injection
I for one am pleasantly surprised at the capabilities and stability of STM32CubeIDE running on Ubuntu. While creating this tutorial I found that it ran smoothly and every feature that I wanted was present. I’m pleased with the capabilities of the integrated debugger - it was a damn sight easier than my previous method, that’s for sure.
If you made it this far, thanks for reading, and hopefully this blogpost was at least somewhat helpful and interesting!